
When working with clients to develop their cloud strategy, we often are asked which IaaS platform has the best price for performance for Windows Server. The correct answer to that question is… it depends. The reason why that is the correct answer is because different workloads often play more to one service's strengths than another's. While this is the correct answer, it is always good to have some empirical evidence to fall back on when talking about generalities. To find that information for ourselves, Synergy Technical executed a series of IaaS platform performance tests from March 5th through 9th of this year the results of which are presented here.
Test Setup
We compared the two main IaaS platforms that interest our clients, Amazon Web Services (AWS) and Microsoft Windows Azure. There is a good degree of variation in VM specs and so the test methodology was to perform a head to head test. Since the main intent of this test was to analyze on a price for performance basis, we matched up VMs from both platforms based on their per hour price. The following table describes the VMs tested*:
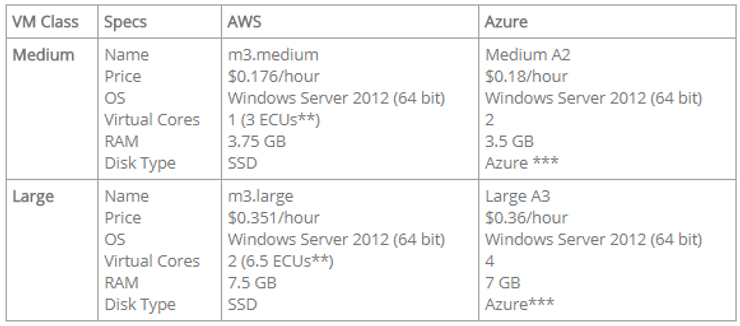
* Since Synergy Technical and the bulk of its clients are located in the Eastern US, AWS and Azure Eastern regions were used for this test
** Amazon provides its own metric for compute performance the Elastic Compute Unit (ECU)
*** Windows Azure’s disk type is reported to be a hybrid of SSDs for journaling and standard disks for persistence
The majority of tests executed were done using the NovaBench benchmarking software but because NovaBench’s disk performance tests are somewhat limited we used CrystalDiskMark to test disk performance.
Scoring Methodology
As you can see, at nearly an identical price point each cloud platform provides some very similar specs and some that are very different. Our goal for this test is to come up with a price for performance measurement for each VM. Our method for coming up with this measurement is to score the performance of each VM based on the categories of processing strength, RAM size and performance and disk performance. Our goal is to score each VM relative to its competitor in its class – the test result for each test will be used as the benchmark, all VMs will have their test result divided by the benchmark in order to determine their relative score. This means that the top performing VM for a test will receive a maximum score of 1 and the competitor’s score will indicate its relative strength as compared to the benchmark. All tests in a category will be averaged to determine each VM’s score in that category. All of the scores in categories will be averaged to determine the VM’s overall score. All tests were run 3 times and their results were averaged (in practice, the tests were very consistent across the tests).
Processor Performance
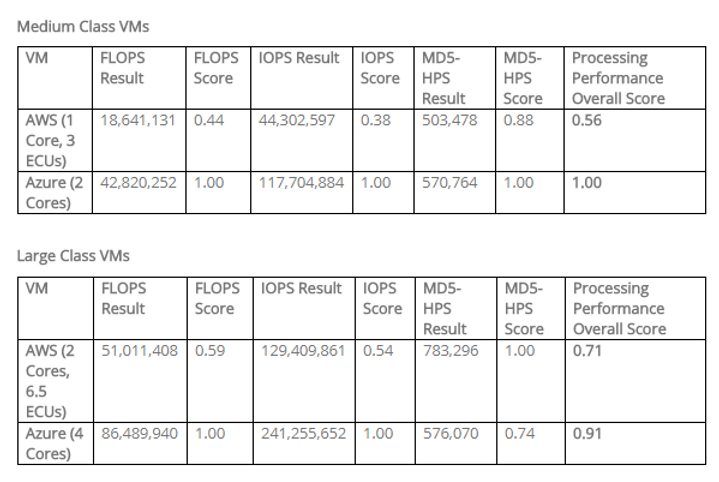
NovaBench performs 3 separate processor performance tests: Floating Point Operations per Second (FLOPS), Integer Operations per Section (IOPS) and MD5 Hashes Generated per Second (MD5-HPS). The following tables show the results of those tests for each VM in each class:
Processing Performance Results
As you can see, at the compared price points Windows Azure performs significantly better (50% on average) than Amazon Web Services. This tells us that the number of reported cores is a fairly good indicator of performance when comparing the platforms. Interestingly, AWS bucked this trend with the MD5-HPS test on the Large class VM.
Memory Performance
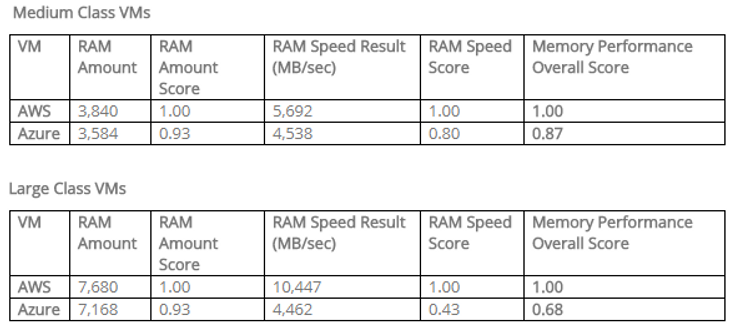
NovaBench provides a single metric for memory performance: RAM Speed (MB/s). Additionally we included memory size as a scorable attribute for each VM since that is typically relevant when selecting a VM size. The following tables show the results of those tests for each VM in each class:
Memory Performance Results
Based on these results, it appears that in addition to providing additional memory in its large VM, Amazon also improves the performance of that memory whereas Azure’s performance remains constant. This test result was confirmed across multiple tests of multiple VMs. Not included in this assessment is an evaluation of the high memory instances that are available in both platforms.
Disk Performance
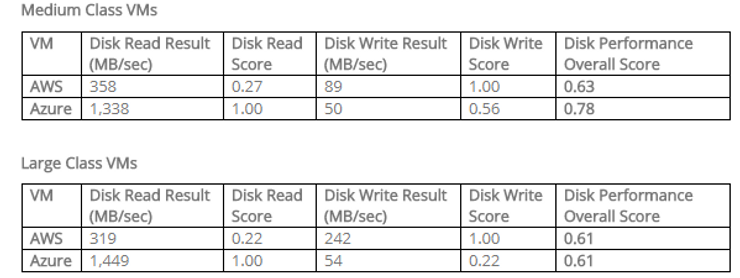
NovaBench provides a single metric for disk performance: Disk Write Speed (MB/s) which was included in the Disk Write Result average. Crystal Disk Mark does a variety of read and write tests that made up the bulk of the score disk performance test results. The following tables show the results of those tests for each VM in each class:
Disk Performance Results
The disk performance tests were the most interesting of all the tests. The overall scores end up very similar but the components of those scores are very dissimilar. Windows Azure’s disks were much better on the read tests than Amazon Web Services’ disks, however Azure’s writes were not as good as Amazon’s by almost the same margin. These results were so different that a retest was performed in order to verify the results – the retest confirmed the initial findings. This would indicate that Azure is best for read intensive workloads while AWS is best for write intensive workloads. Not included in this test are disk IO optimizations such as volume striping that would likely improve these numbers.
Overall Results
The goal of this comparison was to ascertain the true price for performance for each of the classes of VMs tested. This is done by taking the base price per hour for each VM and dividing by its score to come up with a performance adjusted price. Think of this as an “opportunity cost” comparison that would indicate how each of these VMs would perform if you could give them the added boost in each category to even out their performance.
The following tables show the results for each VM in each class:
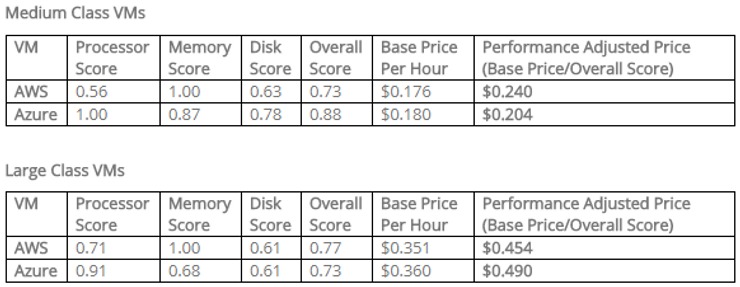
Based on an even weighting, the two IaaS service come up very close in terms of the calculated price for performance metric. For the Medium Class VMs, Windows Azure is more economical by $0.036 per hour ($25.92/month). For the Large Class VMs, Amazon Web Services is more economical, interestingly, by the exact same amount per hour.
The reality is that most workloads deployed into an IaaS environment would not be weighted evenly nor would most workloads be executed under the ideal circumstances under which these tests were performed. The results of this comparison say two things clearly, both platforms are strong contenders and the only true way to truly determine which one best meets your needs is to use this as a guide based upon your knowledge of how your systems are used (CPU intensive, memory intensive, disk read/write intensive, etc.) then performance test your specific scenarios to know how each IaaS platform meets your needs.
Comments